BL AST
Byfarthemostwidelyusedtechniquefordetectingsimilaritybetweensequencesofinterest
is the Basic Local Alignment Search Tool, or BLAST (Altschul et al. 1991). The widespread
adoptionofBLASTasacornerstonetechniqueinsequenceanalysisliesinitsabilitytodetect
similaritiesbetweennucleotideandproteinsequencesaccuratelyandquickly,withoutsacri-
ficingsensitivity.Theoriginal,standardfamilyofBLASTprogramsisshowninTable3.2,but
inthetimesinceitsintroductionmanyvariationsoftheoriginalBLASTprogramhavebeen
developedtoaddressspecificneedsintherealmofpairwisesequencecomparison,severalof
whichwillbediscussedinthischapter.
The Algorithm
用途:
范围:PDF page 72 - PDF page 74;印刷页码 52-54。
边界:从 “The Algorithm” 标题开始,到 “Performing a BLAST Search” 标题前结束。
图表归属:包含 Table 3.2、Figure 3.3、Figure 3.4;Table 3.2 在 PDF 文本抽取顺序中紧随本小节开头后出现,Figure 3.3/3.4 为算法说明图。
The Algorithm
BLASTisalocalalignmentmethodthatiscapableofdetectingnotonlythebestregionoflocal
alignmentbetweenaquerysequenceanditstarget,butalsowhetherthereareotherplausi-
blealignmentsbetweenthequeryandthetarget.Tofindtheseregionsoflocalalignmentina
computationallyefficientfashion,themethodbeginsbyseedingthesearchwithasmallsub-
set of letters from the query sequence, known as thequery word. Using the example shown
in Figure 3.3, consider a search where the query word of default length 3 is RDQ. (In prac-
tice,allwordsoflength3areconsidered,so,usingthesequenceinFigure3.3,thefirstquery
wordwouldbeTLS,followedbyLSH,andsoonacrossthesequence.)BLASTnowneedsto
find not only the word RDQ in all of the sequences in the target database but also related
wordswhereconservativesubstitutionshavebeenintroduced,asthosematchesmayalsobe
biologicallyinformativeandrelevant.TodeterminewhichwordsarerelatedtoRDQ,scoring
matricesareusedtodevelopwhatiscalledtheneighborhood.ThecenterpanelofFigure3.3
showsthecollectionofwordsthatarerelatedtotheoriginalqueryword,indescendingscore
order; the scores here are calculated using a BLOSUM62 scoring matrix (Figure 3.1). Obvi-
ously,somecut-offmustbeappliedsothatfurtherconsiderationisonlygiventowordsthat
areindeedcloselyrelatedtotheoriginalqueryword.Theparameterthatcontrolsthiscut-off
is the neighborhood score threshold (T). The value ofT is determined automatically by the
BLASTprogrambutcanbeadjustedbytheuser.Increasing T wouldpushthesearchtoward
more exact matches and would speed up the search, but could lead to overlooking possibly
interestingbiologicalrelationships.Decreasing Tallowsforthedetectionofmoredistantrela-
tionshipsbetweensequences.Here,onlywordswith T ≥11movetothenextstep.
T able 3.2 BLAST algorithms.
Program Query Database
BLASTN Nucleotide Nucleotide
BLASTP Protein Protein
BLASTX Nucleotide,six-frametranslation Protein
TBLASTN Protein Nucleotide,six-frametranslation
TBLASTX Nucleotide,six-frametranslation Nucleotide,six-frametranslation
BLAST 53
Query Word (W = 3)
Establish neighborhood
Extension using neighborhood
words greater than neighborhood
score threshold (T = 11)
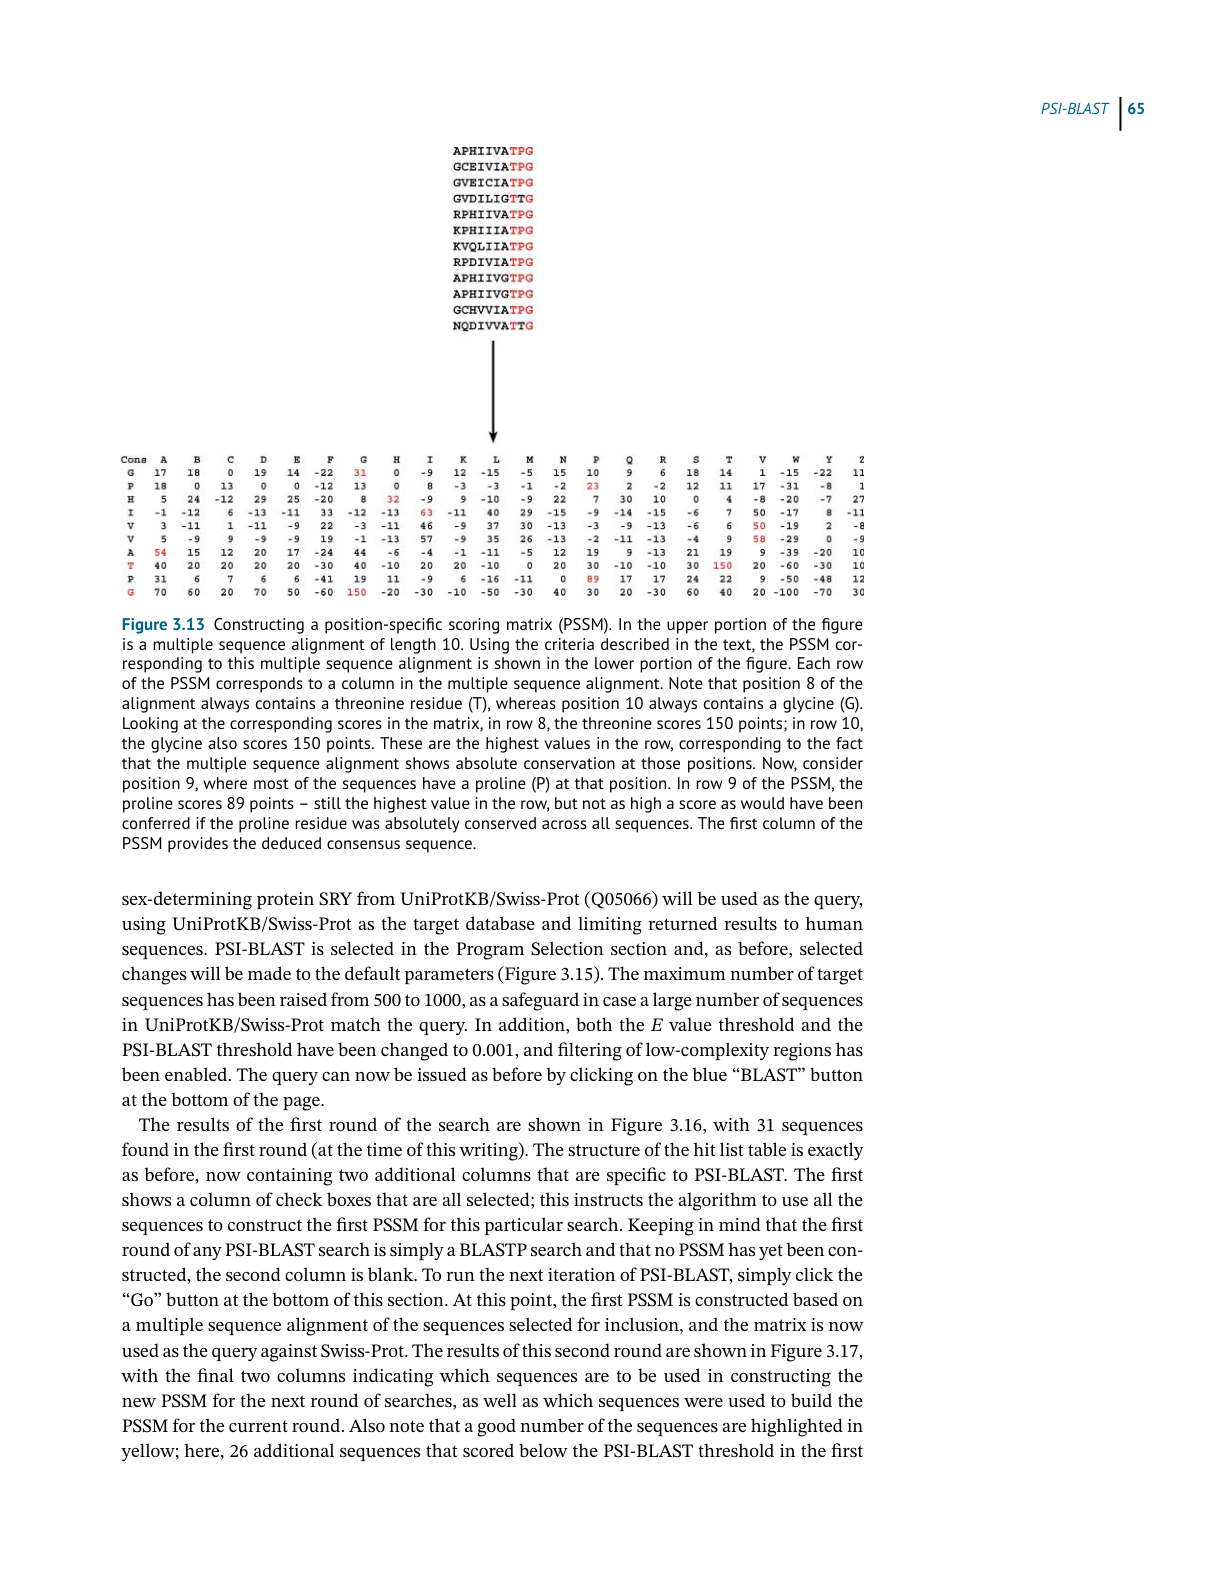
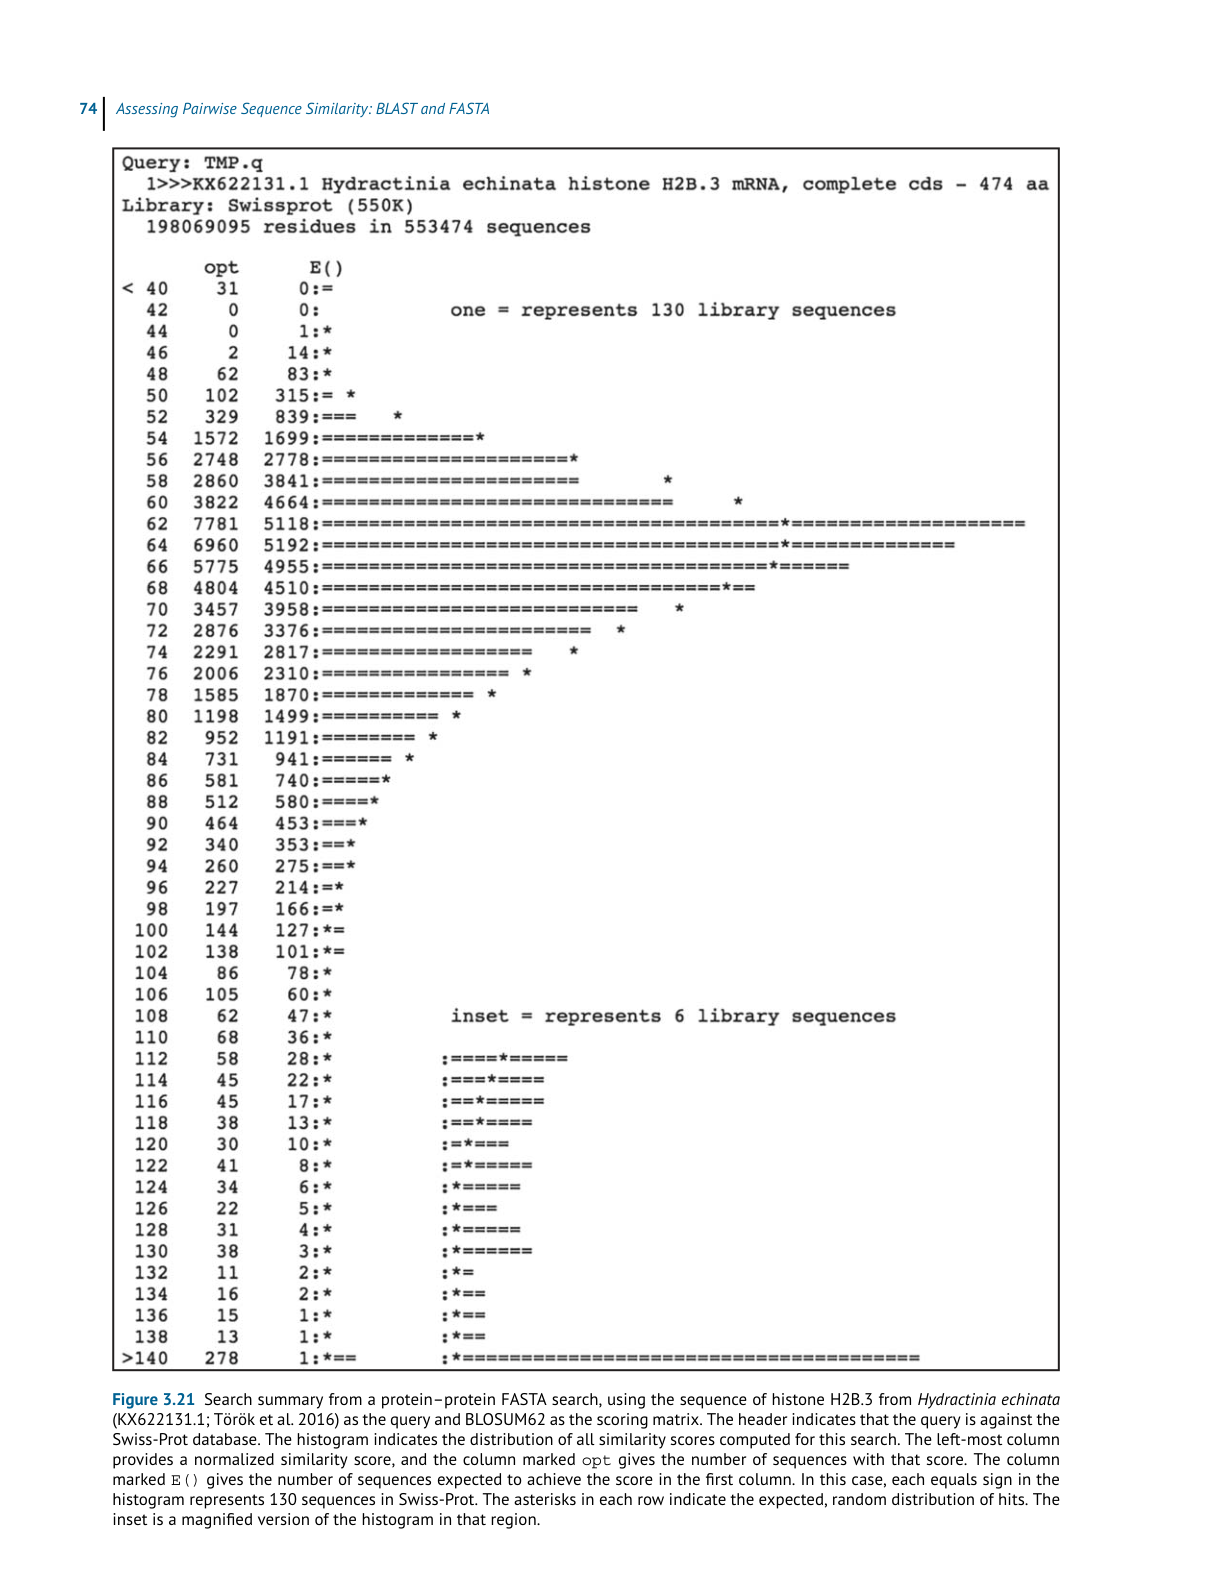
Figure 3.3 The initiation of a BLAST search. The search begins with query words of a given length (here,
three amino acids) being compared against a scoring matrix to determine additional three-letter words
“in the neighborhood” of the original query word. Any occurrences of these neighborhood words in
sequences within the target database are then investigated. See text for details.
Focusing now on the lower panel of Figure 3.3, the original query word (RDQ) has been
alignedwithanotherwordfromtheneighborhoodwhosescoreismorethanthescorethresh-
old ofT ≥11 (REQ). The BLAST algorithm now attempts to extend this alignment in both
directions,tallyingacumulativescoreresultingfrommatches,mismatches,andgaps,untilit
constructsalocalalignmentofmaximallength.Determiningwhatthemaximallengthactually
iscanbebestexplainedbyconsideringthegraphinFigure3.4.Here,thenumberofresidues
that have been alignedis plotted against the cumulative score resulting from the alignment.
Theleft-mostpointonthegraphrepresentsthealignmentoftheoriginalquerywordwithone
ofthewordsfromtheneighborhood,againhavingavalueof T =11orgreater.Astheexten-
sionproceeds,aslongasexactmatchesandconservativesubstitutionsoutweighmismatches
Length of extension
Length of HSP
X
S
T
Cumulative score
Figure 3.4 BLAST search extension. Length of extension represents the number of characters that
have been aligned in a pairwise sequence comparison. Cumulative score represents the sum of the
position-by-position scores, as determined by the scoring matrix used for the search. T represents the
neighborhood score threshold, S is the minimum score required to return a hit in the BLAST output, and
X is the significance decay. See text for details.
54 Assessing Pairwise Sequence Similarity: BLAST and FASTA
andgaps,thecumulativescorewillincrease.Assoonasthecumulativescorebreaksthescore
thresholdS,thealignmentisreportedintheBLASToutput.Simplyclearing Sdoesnotauto-
maticallymeanthatthealignmentisbiologicallysignificant,averyimportantpointthatwill
beaddressedlaterinthisdiscussion.
As the extension continues, at some point, mismatches and gaps will begin to outweigh
the exact matches and conservative substitutions, accruing negative scores from the scoring
matrix.Assoonasthecurvebeginstoturndownward,BLASTmeasureswhetherthedrop-off
exceedsathresholdcalled X.Ifthecurvedecaysmorethanisallowedbythevalueof X,the
extension is terminated and the alignment is trimmed back to the length corresponding to
the preceding maximum in the curve. The resulting alignment is called ahigh-scoring seg-
mentpair,orHSP.GiventhattheBLASTalgorithmsystematicallymarchesacrossthequery
sequenceusingallpossiblequerywords,itispossiblethatmorethanoneHSPmaybefound
foranygivensequencepair.
AfteranHSPisidentified,itisimportanttodeterminewhethertheresultingalignmentis
actuallysignificant.Usingthecumulativescorefromthealignment,alongwithanumberof
other parameters,anew valuecalled E (for “expect”) is calculated(Box3.2).For eachhit,E
givesthenumberofexpectedHSPshavingascoreof SormorethatBLASTwouldfindpurely
bychance.Putanotherway,thevalueof EprovidesameasureofwhetherthereportedHSPis
afalsepositive(seeBox5.4).Lower Evaluesimplygreaterbiologicalsignificance.
Box 3.2 The Karlin–Altschul Equation
As one might imagine, assessing the putative biological significance of any given BLAST hit
based simply on raw scores is difficult, since the scores are dependent on the composition
of the query and target sequences, the length of the sequences, the scoring matrix used
to compute the raw scores, and numerous other factors. In one of the most important
papers on the theory of local sequence alignment statistics, Karlin and Altschul (1990)
presented a formula which directly addresses this problem. The formula, which has come
to be known as the Karlin–Altschul equation, uses search-specific parameters to calculate
an expectation value (E). This value represents the number of HSPs that would be expected
purely by chance. The equation and the parameters used to calculate E are as follows:
E = kmNe
−𝜆s
where k is a minor constant, m is the number of letters in the query, N is the total number
of letters in the target database, 𝜆is a constant used to normalize the raw score of the
high-scoring segment pair, with the value of 𝜆varying depending on the scoring matrix
used; and S is the score of the high-scoring segment pair.
Ch3 Performing a BLAST Search 原文抽取
>
> 实际 PDF 小节名:Performing a BLAST Search / Understanding the BLAST Output
> 范围:PDF page 74 下半 - PDF page 81 顶部;印刷页码 54-61
> 边界:从 “Performing a BLAST Search” 标题开始,到下一小节标题前结束。
Performing a BLAST Search
While many BLAST servers are available throughout the world, the most widely used portal
for these searches is the BLAST home page at the National Center for Biotechnology Infor-
mation (NCBI; Figure 3.5). The top part of the page provides access to the most frequently
performed types of BLAST searches, summarized in Table 3.2, while the lower part of the page
is devoted to specialized types of BLAST searches. To illustrate the relative ease with which
one can perform a BLAST search, a protein-based search using BLASTP is discussed. Click-
ing on the Protein BLAST box brings users to the BLASTP search page, a portion of which is
shown in Figure 3.6. Obviously, a query sequence that will be used as the basis for comparison
is required. Harking back to the Entrez discussion in Chapter 2, the sequence of the netrin
receptor from Homo sapiens (NP_005206.2) has been pasted into the query sequence box.
Immediately to the right, the user can use the query subrange boxes to specify whether only a
portion of this sequence is to be used; if the whole sequence is to be used, these fields should
be left blank.
BLAST
Figure 3.5 The National Center for Biotechnology Information (NCBI) BLAST landing page. Examples of the most commonly used queries
that can be performed using the BLAST interface are discussed in the text.
Moving to the Choose Search Set section of the page, the database to be searched can be
selected using the Database pull-down menu; clicking on the question mark next to the
Database pull-down provides a brief description of each of the available target databases.
Here, the search will be performed against the RefSeq database (see Box 1.2). Directly below,
the Organism box can be used to limit the search results to sequences from individual
organisms or taxa. While not part of this worked example, if the user wanted to limit the
returned results to those from just mouse and rat, using the same type of syntax used in
issuing Entrez searches (see Table 2.1), the user would type Mus musculus [ORGN] AND
Rattus norvegicus [ORGN] in this field; if the user wanted all results except those
from mouse and rat, they would also need to check the Exclude box. As this search will be
performed against RefSeq, one can exclude predicted proteins from the search results by
clicking the “Models (XM/XP)” checkbox. Finally, in the Program Selection section, BLASTP
is selected by default.
Assessing Pairwise Sequence Similarity: BLAST and FASTA
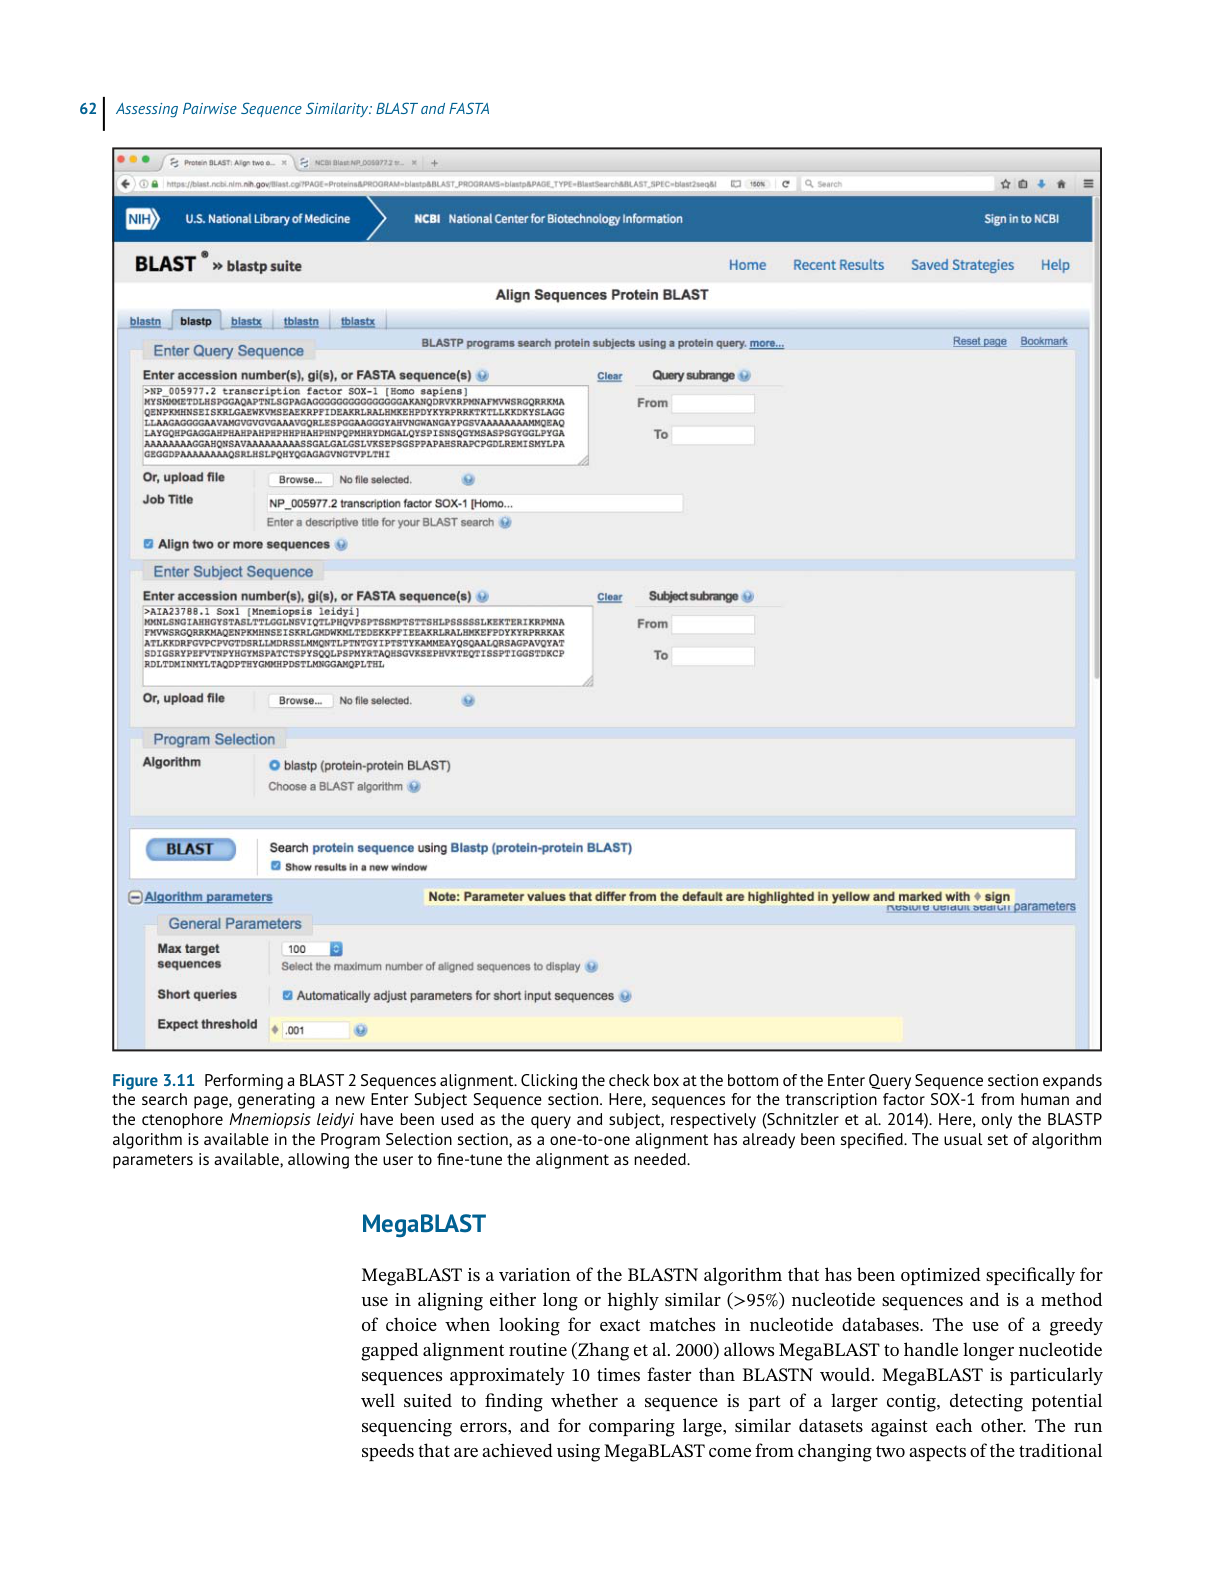
Figure 3.6 The upper portion of the BLASTP query page. The first section in the window is used to specify the sequence of interest, whether
only a portion of that sequence should be used in performing the search (query subrange), which database should be searched, and which
protein-based BLAST algorithm should be used to execute the query. See text for details.
If the user wishes to use the default settings for all algorithm parameters, the search can
be submitted by simply clicking on the blue BLAST button. However, the user can exert finer
control over how the search is performed by changing the items found in the Algorithm param-
eters section. To access these settings, the user must first click on the plus sign next to the words
“Algorithm parameters” to expand this section of the web page, producing the view shown in
Figure 3.7. This part of the query page is where the theory underlying a BLAST search dis-
cussed earlier in this chapter comes into play. In the General Parameters section, the expect
threshold limits returned results to those having an E value lower than the specified value, with
smaller values providing a more stringent cut-off. The word size setting changes the size of the
query word used to initiate the BLAST search, with longer word sizes initiating the search with
longer ungapped alignments. A word size of 3 is recommended for protein searches, as shorter
words increase sensitivity; however, if searching for near-exact matches, a longer word size
can be used, also yielding faster search times.
BLAST
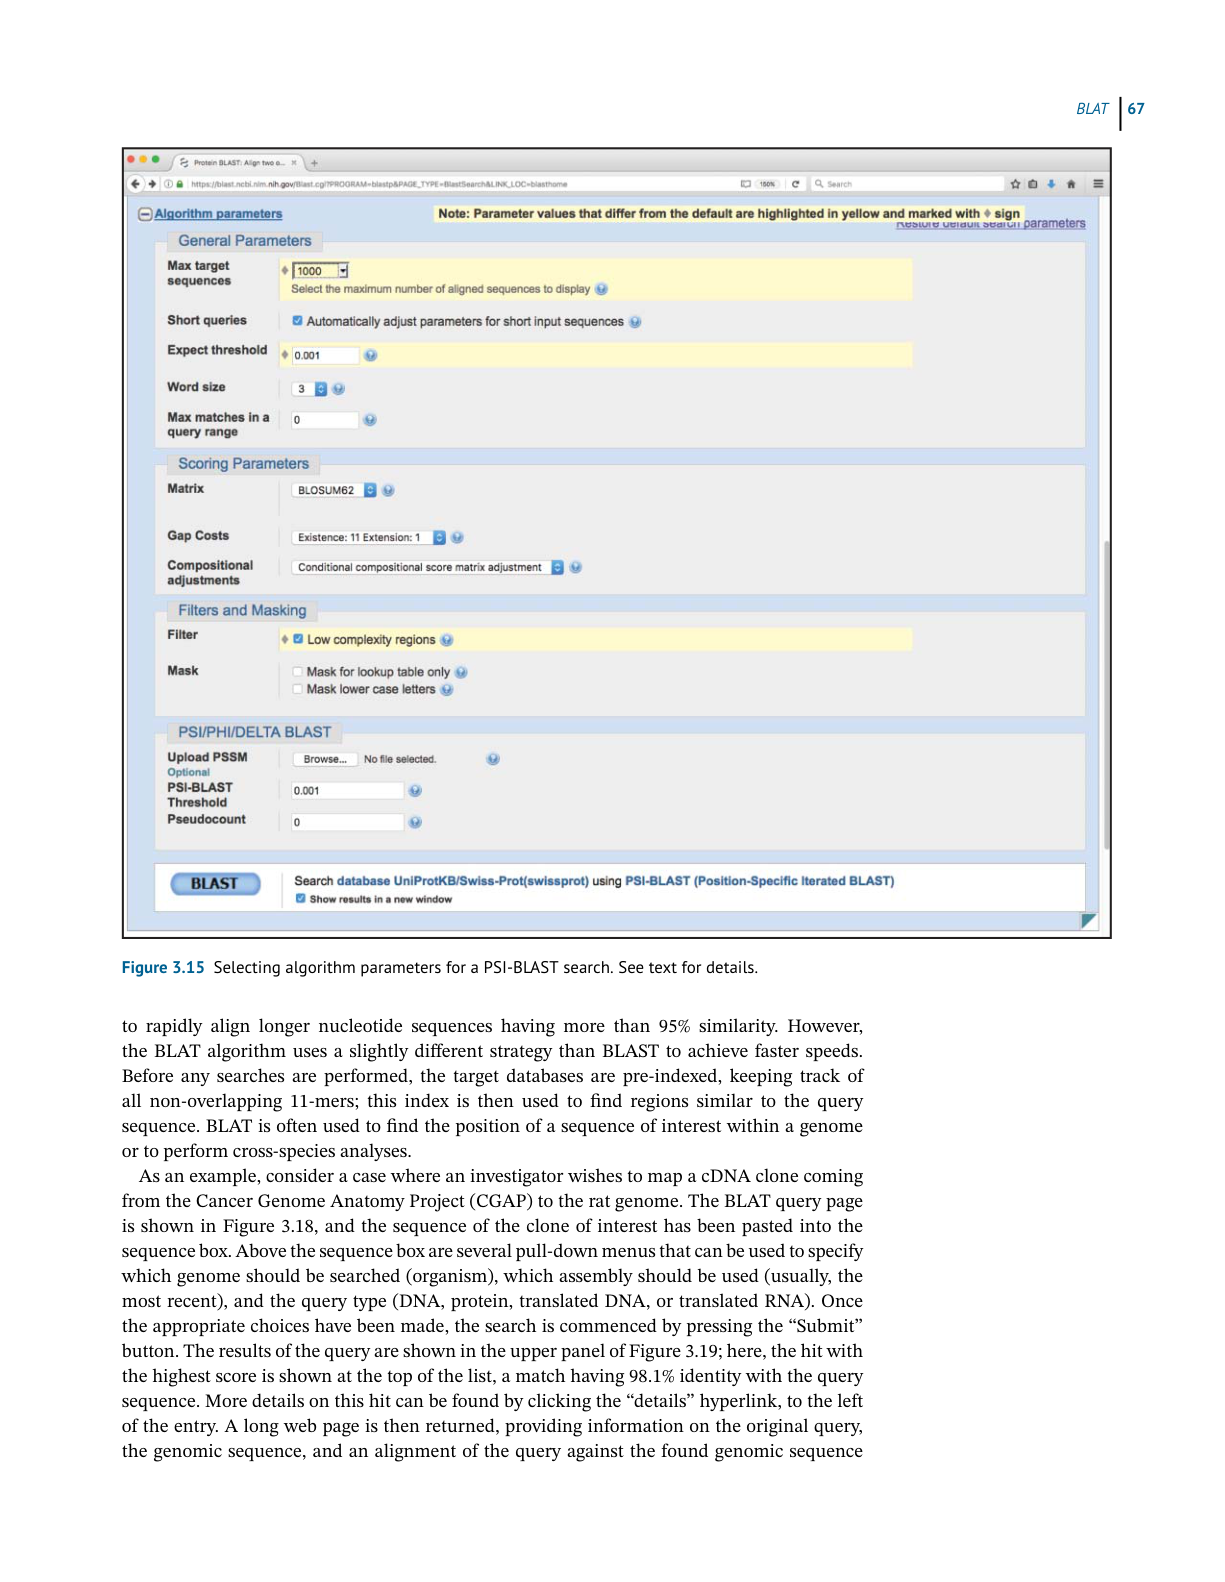
Figure 3.7 The lower portion of the BLASTP query page, showing algorithm parameters that the user can adjust to fine-tune the search.
Values that have been changed for the search discussed in the text are highlighted in yellow and marked with a diamond. See text for
details.
In the Scoring Parameters section, the user can select an appropriate scoring matrix (with
the default being BLOSUM62). Changing the matrix automatically changes the gap penalties to
values appropriate for that scoring matrix. As described in the discussion of affine gap penalties
above, the user may change these values manually; increasing the gap costs would result in
pairwise alignments with fewer gaps, where decreasing the values would make the insertion
of gaps more permissive.
In the Filters and Masking section, one should filter to remove low-complexity regions.
Low-complexity regions are defined simply as regions of biased composition (Wootton
and Federhen 1993). These may include homopolymeric runs, short-period repeats, or the
subtle over-representation of several residues in a sequence. The biological role of these
low-complexity regions is not understood; it is thought that they may represent the results of
either DNA replication errors or unequal crossing-over events. It is important to determine
whether sequences of interest contain low-complexity regions; they tend to prove problematic
when performing sequence alignments and can lead to false-positive results, as they are
Assessing Pairwise Sequence Similarity: BLAST and FASTA
generally similar across unrelated proteins. Finally, before issuing the query, be sure to check
the box marked “Show results in a new window.” This leaves the original query window (or
tab) in place, making it easier to go back and refine or change search parameters, as needed.
Understanding the BLAST Output
The first part of the BLASTP results for the query described above is shown in Figure 3.8. The
top part of the figure shows the position of conserved protein domains found by comparing
the query sequence with data found within NCBI’s Conserved Domain Database (CDD). This
is followed by a graphical overview of the BLASTP results, providing a sense of how many
sequences were found to have similarity to the query and how they scored against the query.
Details of the various graphical display features are given in the legend to Figure 3.8. The actual
list of sequences found as a result of this particular BLASTP search – the “hit list” – is shown,
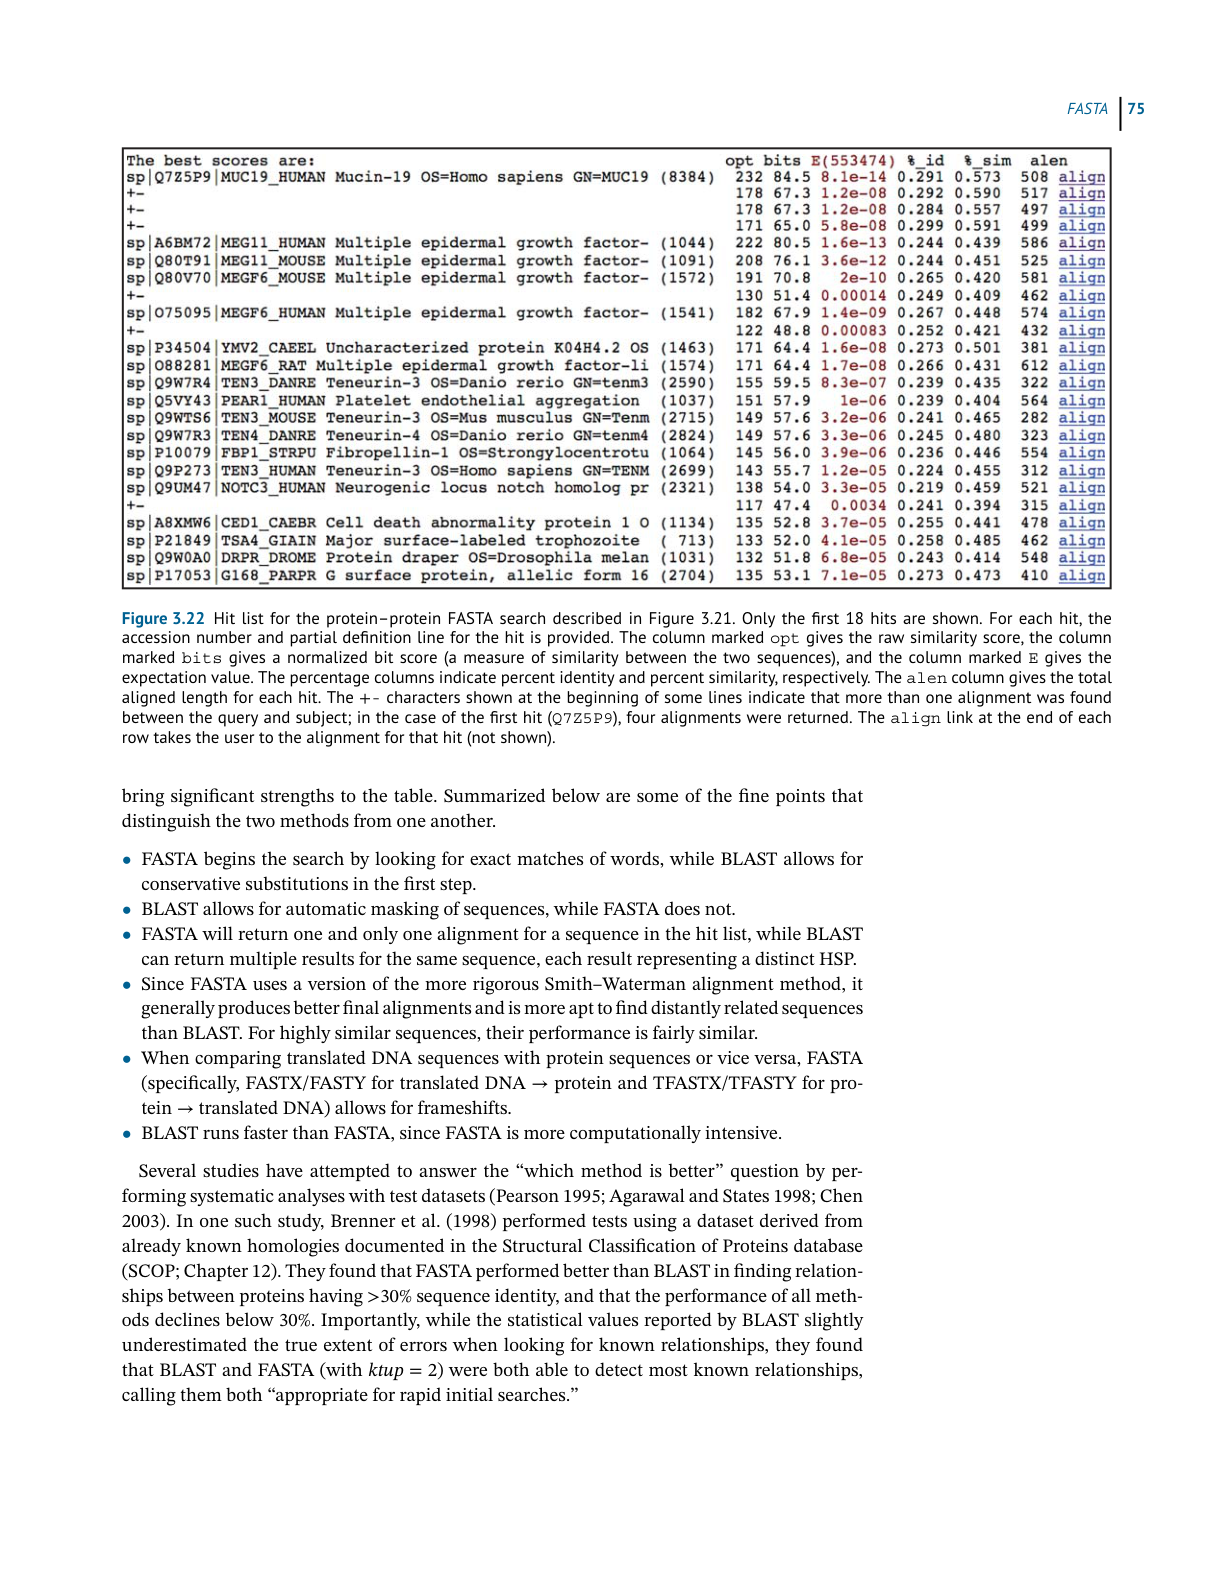
in part, in Figure 3.9. The information included for each hit includes the definition line from
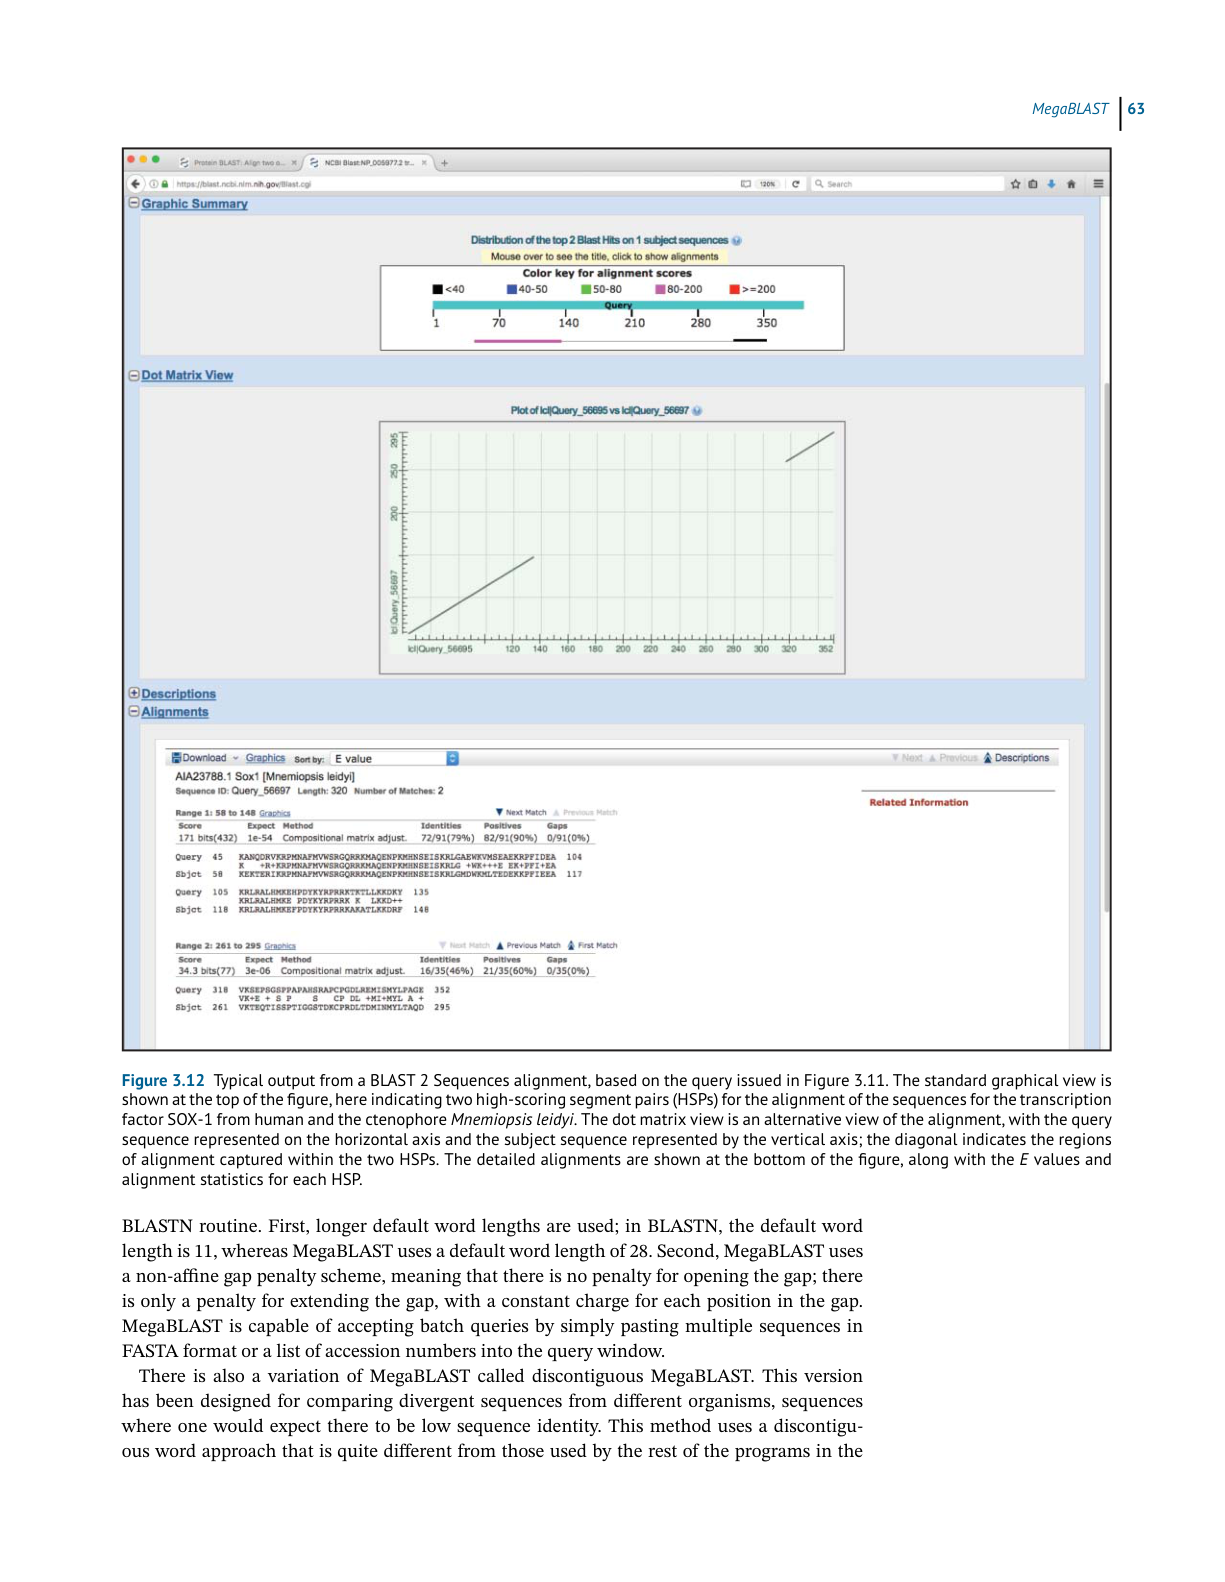
Figure 3.8 Graphical display of BLASTP results. The query sequence is represented by the thick cyan bar labeled “Query,” with the tick
marks indicating residue positions within the query. The thinner bars below the query represent each of the matches (“hits”) detected by
the BLAST algorithm. The colors represent the relative scores for each hit, with the color key for the scores appearing at the top of the box.
The length of each line, as well as its position, represents the region of similarity with the query. Hits connected by a thin line indicate
more than one high-scoring segment pair (HSP) within the same sequence; similarly, a thin vertical bar crossing one of the hits indicates a
break in the overall alignment. Moving the mouse over any of the lines produces a pop-up that shows the identity of that hit. Clicking on
any of the lines takes the user directly to detailed information about that hit (see Figure 3.10).
BLAST
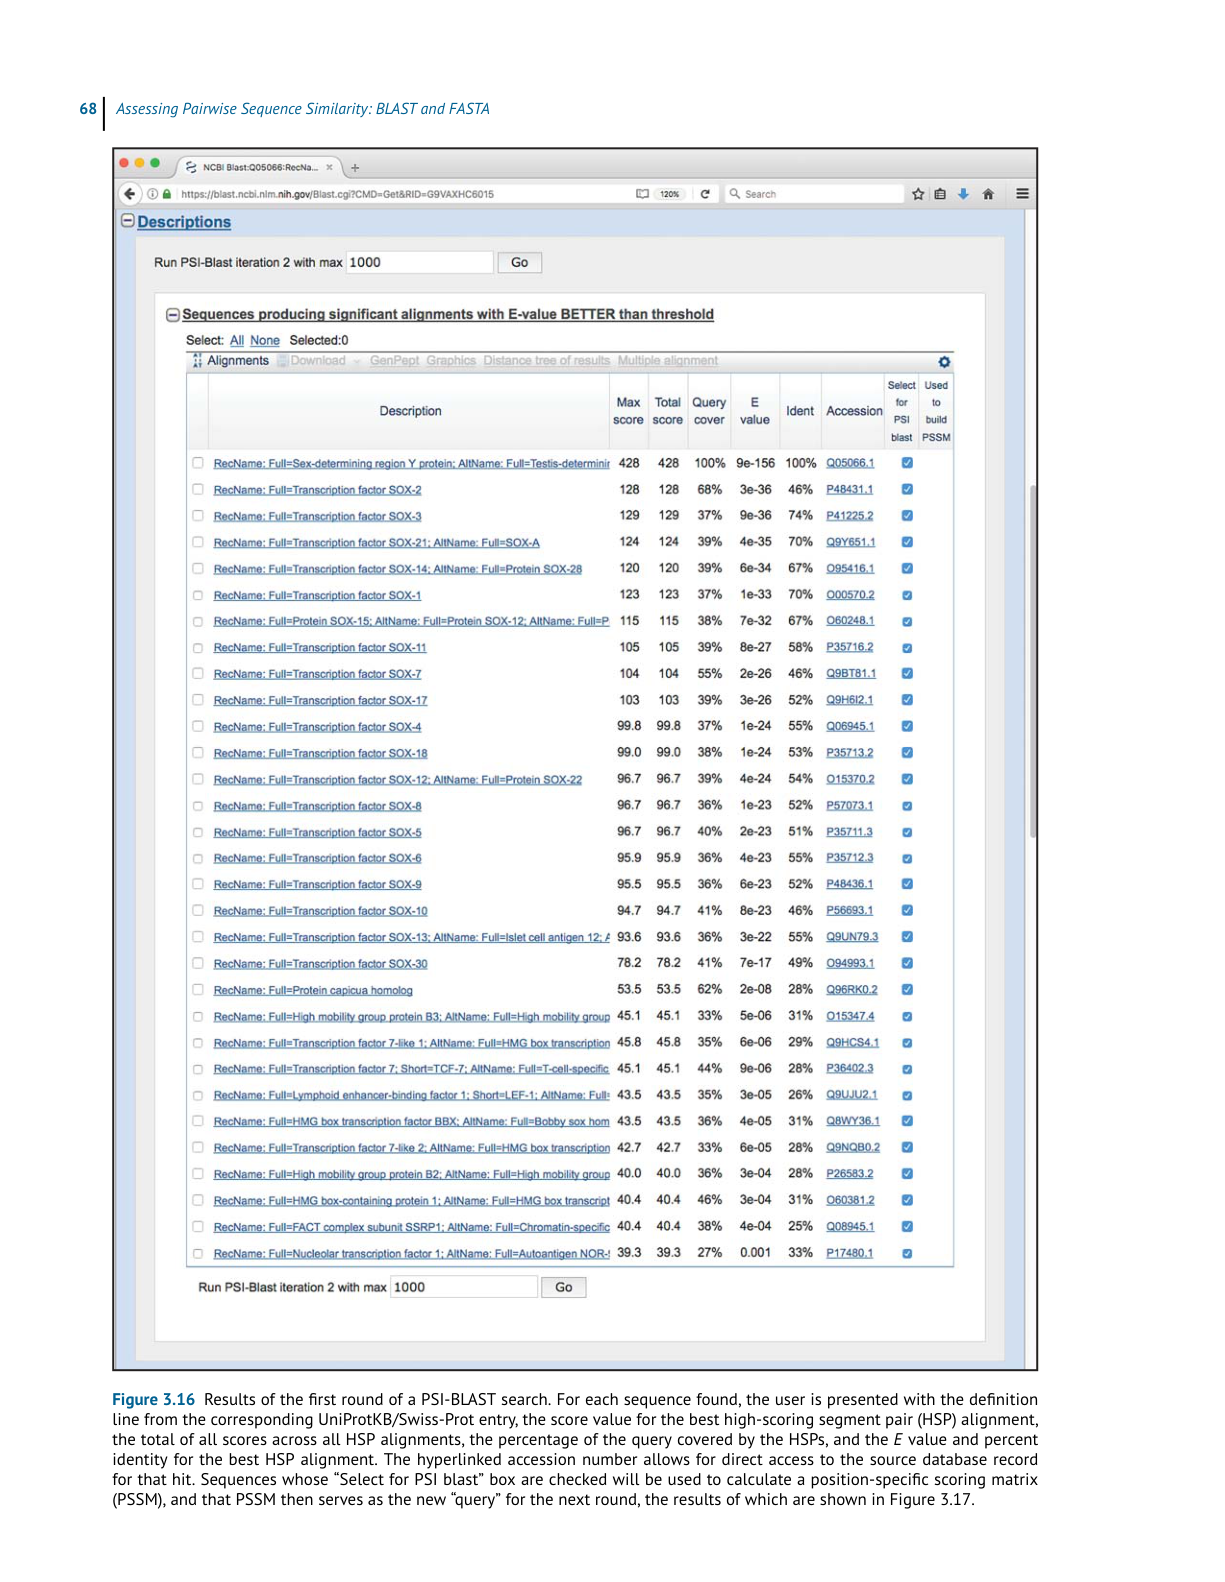
Figure 3.9 The BLASTP “hit list.” For each sequence found, the user is presented with the definition line from the hit’s source database entry,
the score value for the best high-scoring segment pair (HSP) alignment, the total of all scores across all HSP alignments, the percentage of
the query covered by the HSPs, and the E value and percent identity for the best HSP alignment. The hyperlinked accession number allows
for direct access to the source database record for that hit. In the E value column, vanishingly low E values are rounded down to zero. For
non-zero E values, exponential notation is used; using the first non-zero value in the figure, 2e-159 should be read as 2 × 10−159.
the hit’s source database entry, the score value that is, in turn, used to calculate the E value for
the best HSP alignment, the percent identity for that best HSP alignment, and the hyperlinked
accession number, allowing for direct access to the source database record for that hit. The table
is sorted by E value from lowest to highest, by default; recall that lower values of E represent
better alignments. In the E value column, notice that many of the entries have E-values of 0.0.
This represents a vanishingly low E value that has been rounded down to zero and implies
statistical significance. Note that each entry in the hit list is preceded by a check box; checking
one or more of these boxes lights up the grayed-out options shown in Figure 3.9, allowing
the user to download the selected sequences, view the selected hits graphically, generate a
dendrogram, or construct a multiple sequence alignment on the fly.
Clicking on the name of any of the proteins in the hit list moves the user down the page
to the portion of the output showing the pairwise alignment(s) for that hit (Figure 3.10). The
Assessing Pairwise Sequence Similarity: BLAST and FASTA
Figure 3.10 Detailed information on a representative BLASTP hit. The header provides the identity of the hit, as well as the
score and E value. The percent identity indicates exact matches, whereas the percent “positives” considers both exact matches
and conservative substitutions. The gap figures show how many residues remain unaligned owing to the introduction of gaps.
Gaps are indicated by dashes and low-complexity regions are indicated by grayed-out lower case letters. Note that there is
no header preceding the second alignment; this indicates that this is a second high-scoring segment pair (HSP) within the
same database entry.
BLAST 2 Sequences
header provides the complete definition line for this particular hit, and each identified HSP
is then shown below the header. In most cases, the user will only see one alignment, but in
the case shown in Figure 3.10 there are two, with the hit having the better score and E value
shown first. The statistics given for each hit include the E value, the number of identities (exact
matches), the number of “positives” (exact matches and conservative substitutions), and the
number of residues that fell into a gapped region. Within the alignments, gaps are indicated
by dashes, while low-complexity regions are indicated by grayed-out lower case letters.
Ch3 Suggested BLAST Cut-Offs 原文抽取
>
> 实际 PDF 小节名:Suggested BLAST Cut-Offs
> 范围:PDF page 81 中部;印刷页码 61
> 边界:从 “Suggested BLAST Cut-Offs” 标题开始,到下一小节标题前结束。
Suggested BLAST Cut-Offs
As was previously alluded to, the listing of a hit in a BLAST report does not automatically mean
that the hit is biologically significant. Over time, and based on both the methodical testing
and the personal experience of many investigators, many guidelines have been put forward as
being appropriate for establishing a boundary that separates meaningful hits from the rest. For
nucleotide-based searches, one should look for E values of 10−6 or less and sequence identities
of 70% or more. For protein-based searches, one should look for hits with E values of 10−3
or less and sequence identities of 25% or more. Using less-stringent cut-offs risks entry into
what is called the “twilight zone,” the low-identity region where any conclusions regarding
the relationship between two sequences may be questionable at best (Doolittle 1981, 1989;
Vogt et al. 1995; Rost 1999).
The reader is cautioned not to use these cut-offs (or any other set of suggested cut-offs)
blindly, particularly in the region right around the dividing line. Users should always keep
in mind whether the correct scoring matrix was used. Likewise, they should manually inspect
the pairwise alignments and investigate the biology behind any putative homology by read-
ing the literature to convince themselves whether hits on either side of the suggested cut-offs
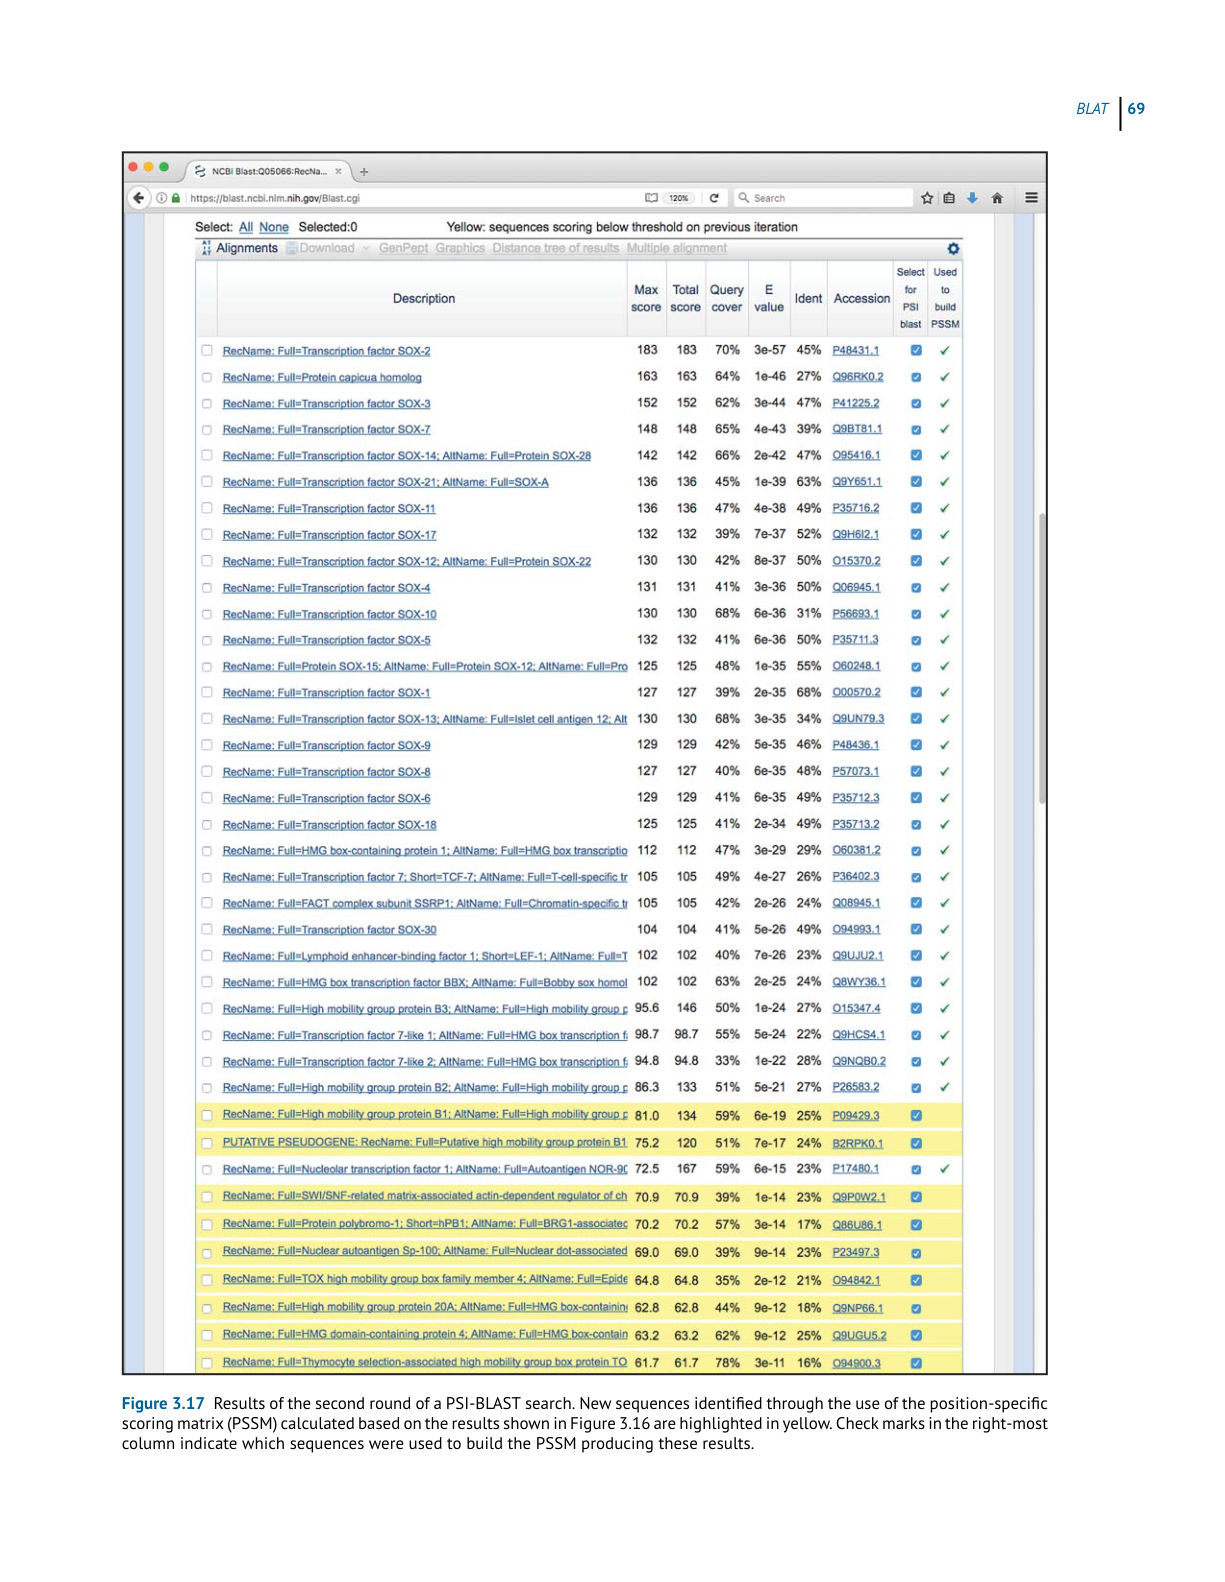
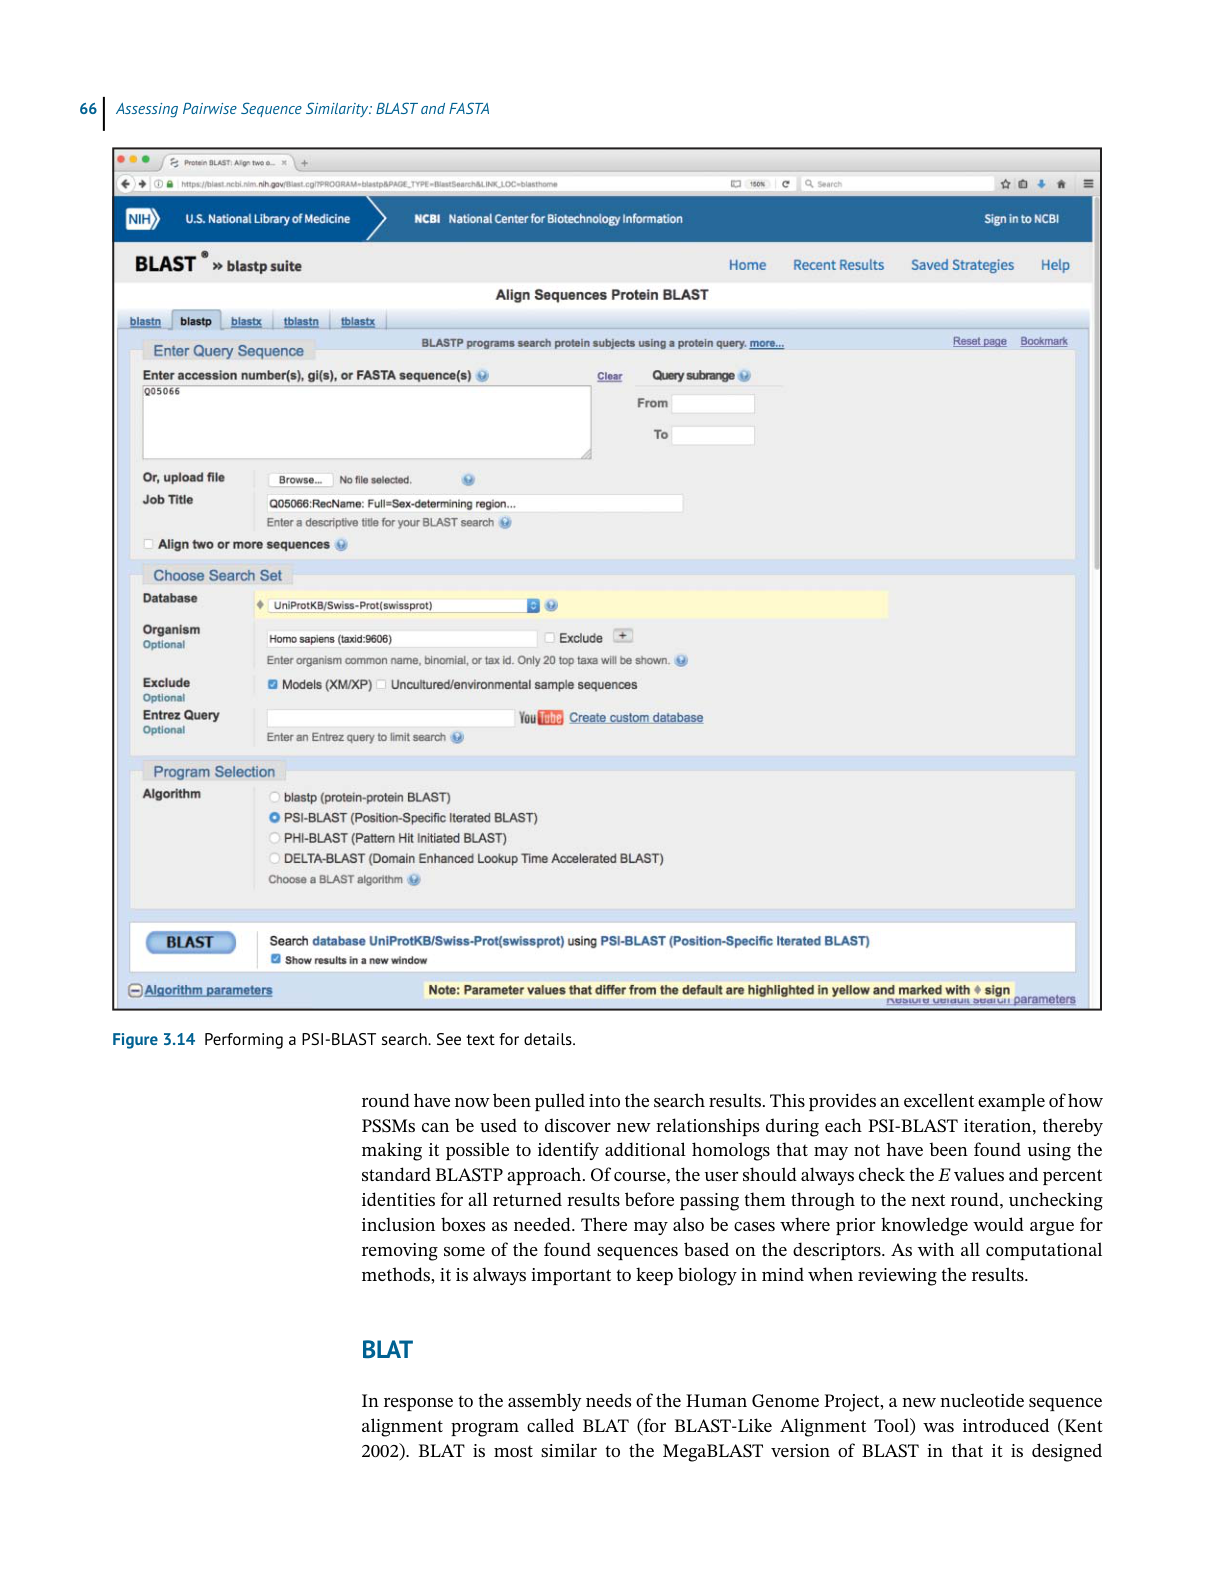
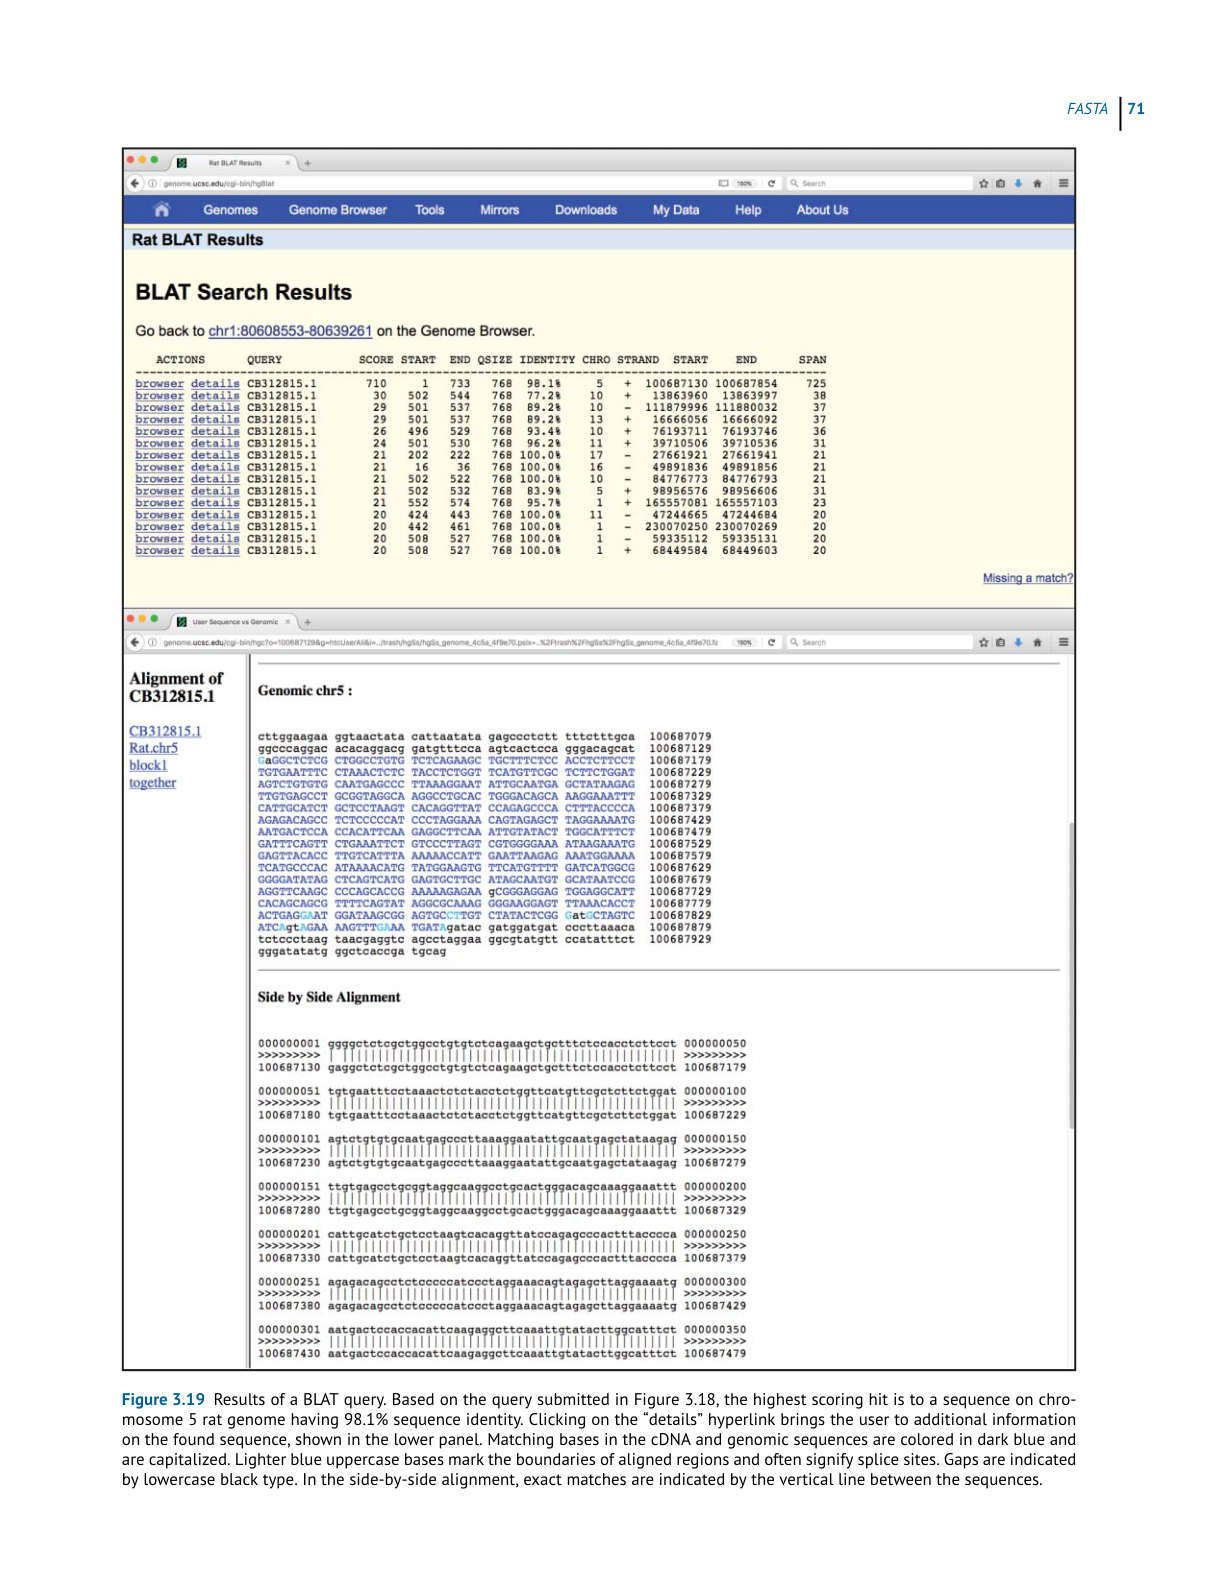
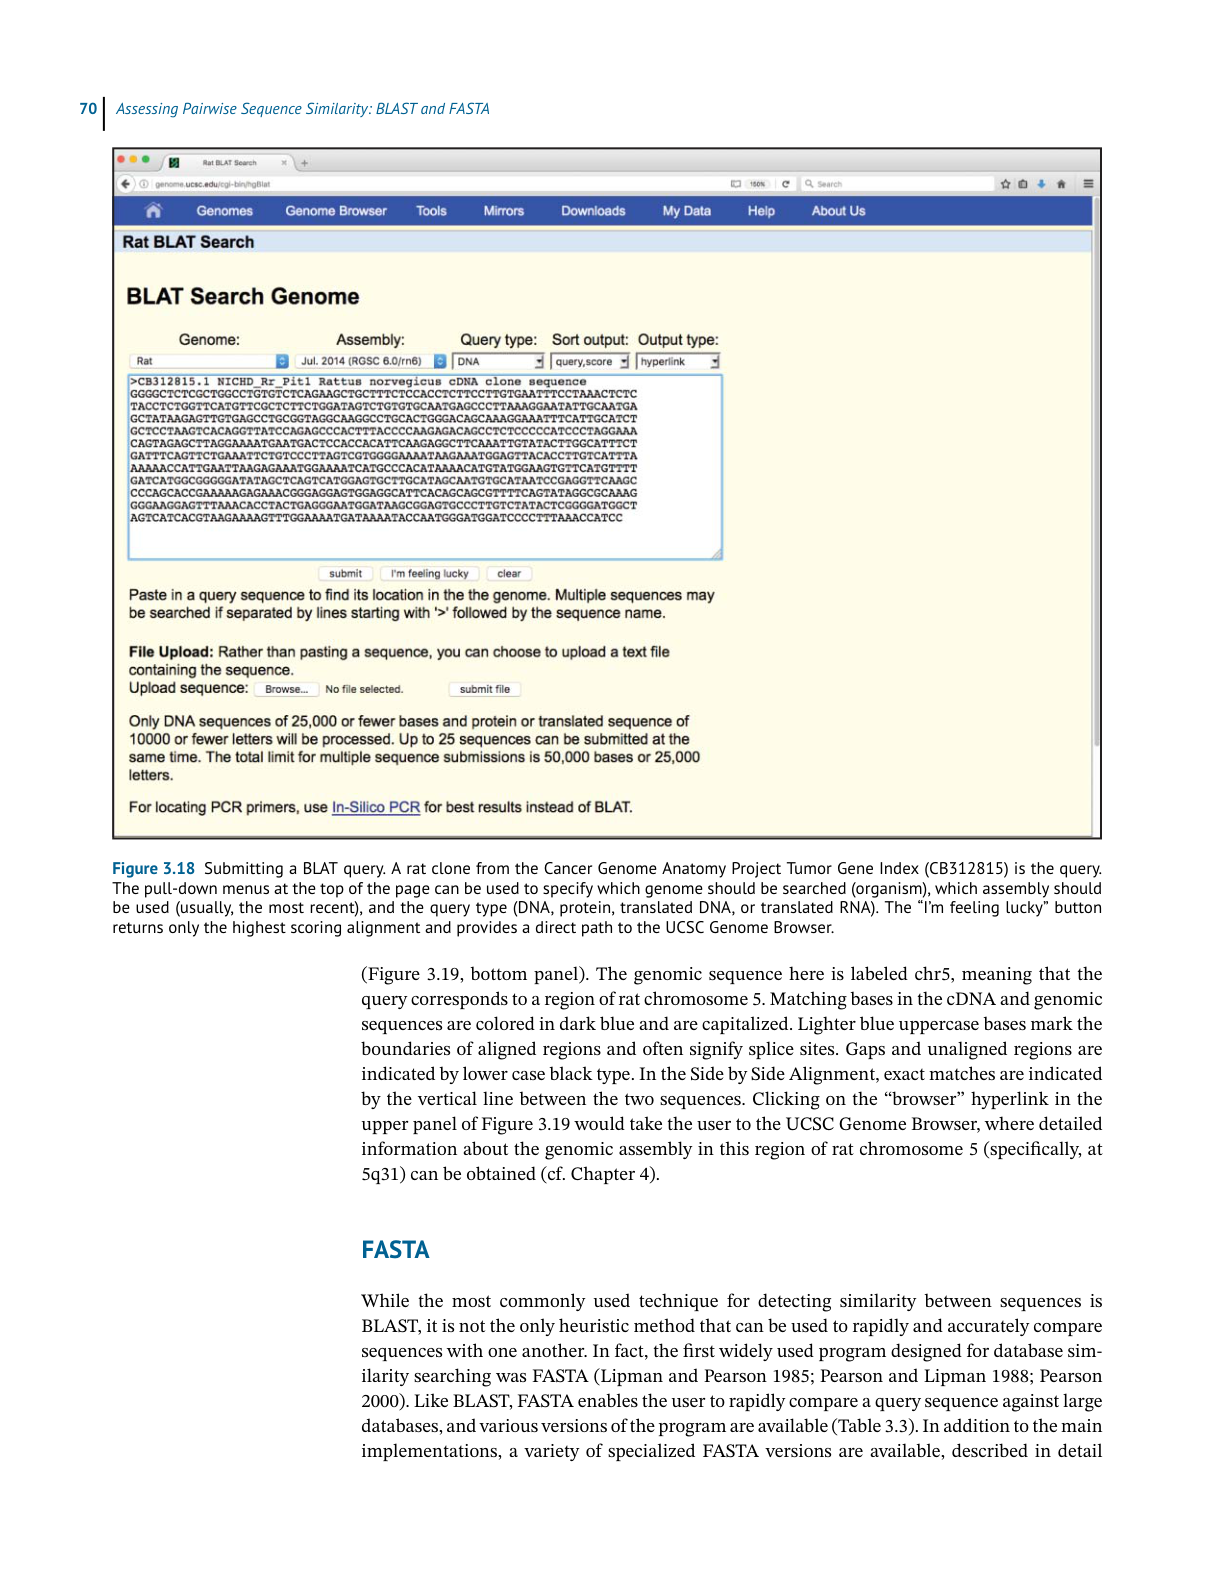
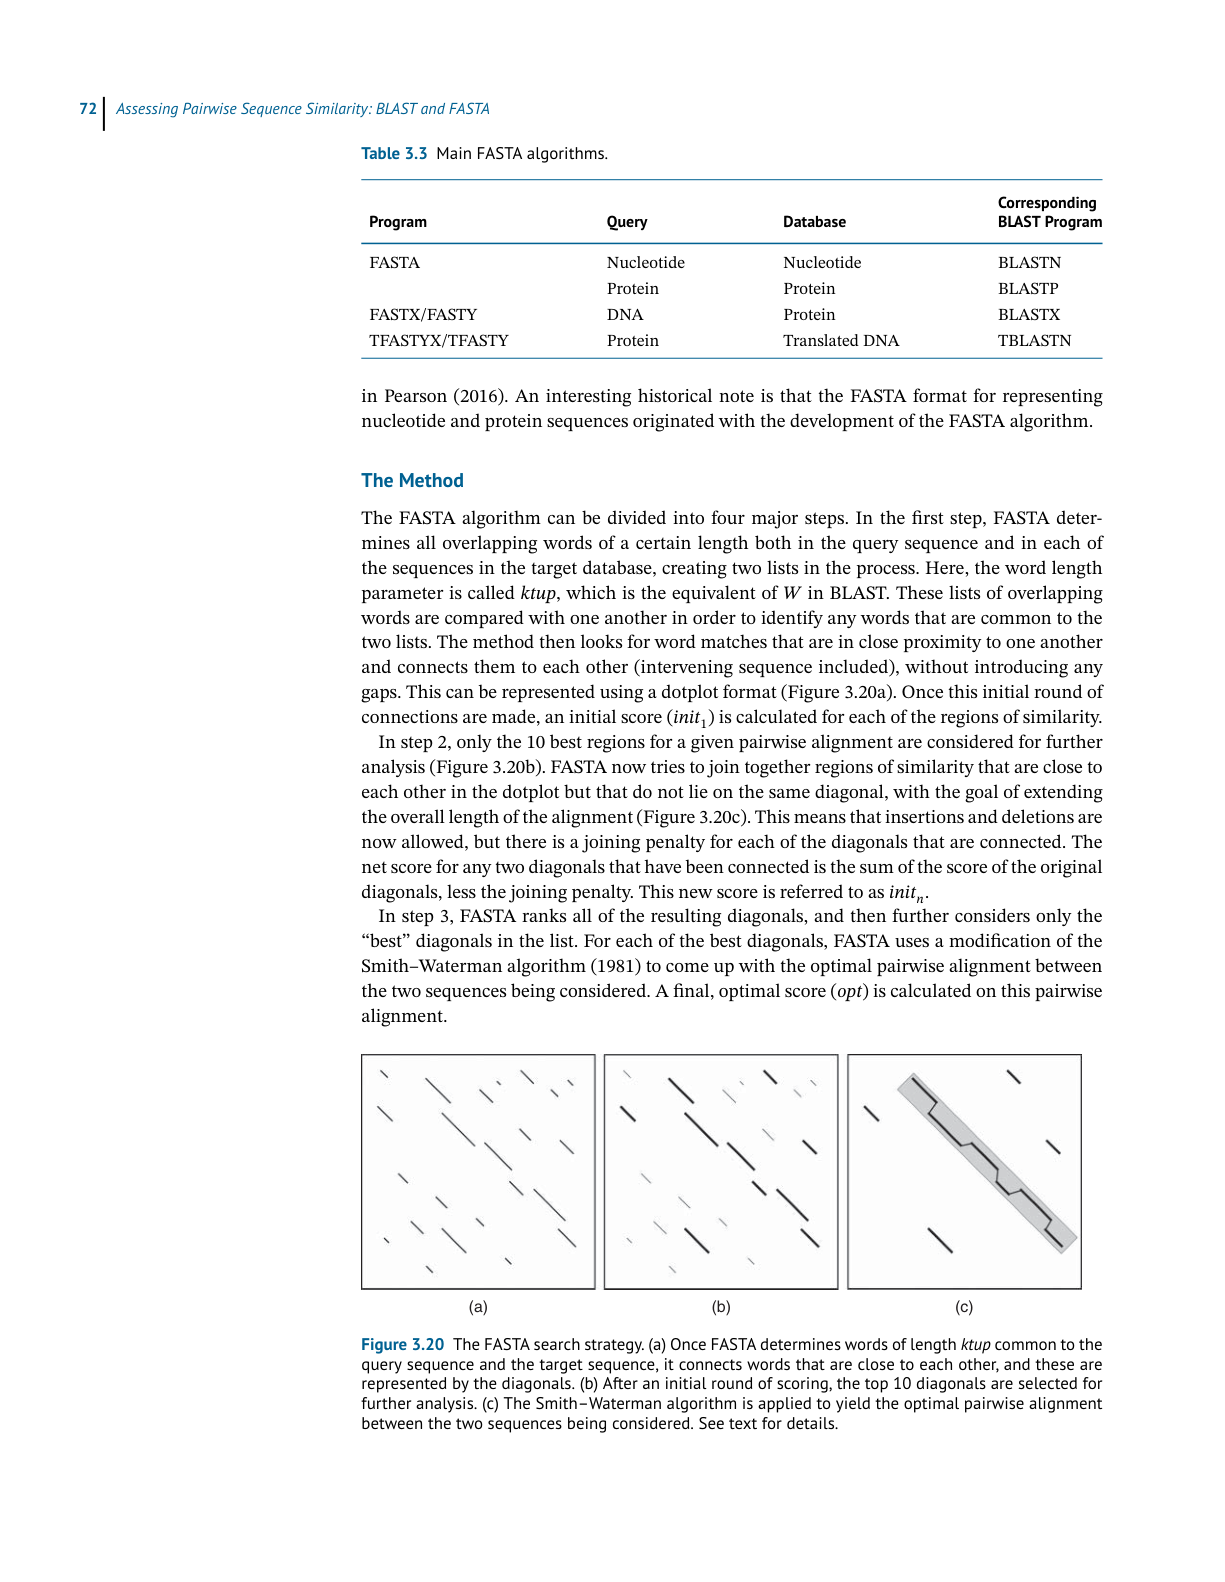
actually make good biological sense.